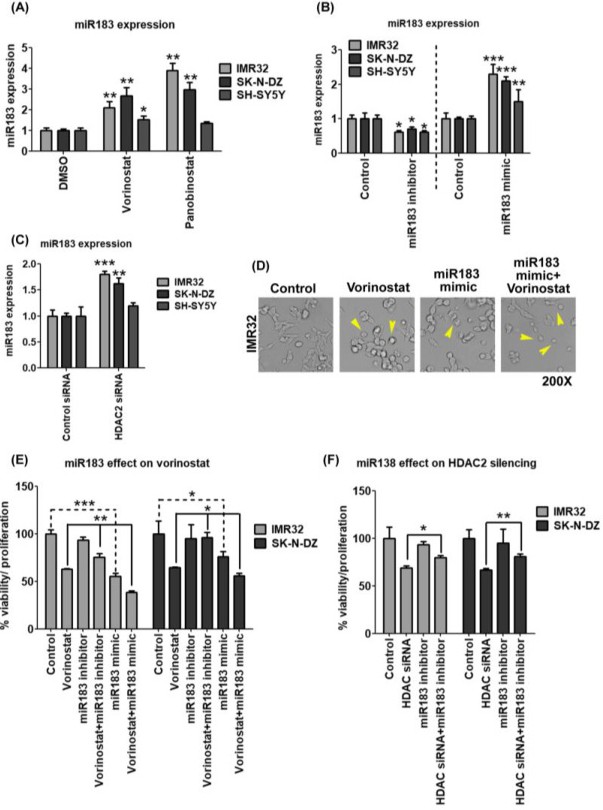
Fig. 7. Vorinostat increased miR183 expression in MYCN overexpressed cells to reduce cell combined viability with proliferation reads. (A) miR183 expression was examined by qPCR following dosing of HDACi for 24 h. Vorinostat (2 µM) and panobinostat (2 µM) were able to increase miR183 expression in IMR-32 and SK-N-DZ cells but not in SH-SY5Y cells. (B) Different neuroblastoma cells were either transfected with miR183 inhibitor oligoes or with miR183 mimic. Expression of miR183 was examined by qPCR and GAPDH was used to normalize the signal. (C) miR183 expression was examined by qPCR in IMR-32, SK-N-DZ, and SH-SY5Y cells after transfecting them with HDAC2 siRNA. GAPDH was the housekeeping control. (D) IMR-32 cell morphology was examined after treatment with vorinostat (2 µM), miR183 mimic and with miR183 and vorinostat together. The photographs were taken by an inverted microscope at 20X magnification. The yellow arrows are indicative of apoptotic cells. (E) IMR-32 and SK-N-DZ cells were treated with vorinostat (2 µM), miR183 inhibitor oligoes or miR183 mimic alone or together. The cell viability/proliferation assay was performed and the relative percentages of viability with proliferation were calculated and plotted as a histogram with GraphPad Prism 5. (F) IMR-32 and SK-N-DZ cells were either transfected with HDAC2 siRNA or with miR183 inhibitor oligoes or both together for 48 h and then the cell viability/proliferation assay was performed and the relative percentages of viability with proliferation were calculated and plotted as a histogram by GraphPad Prism 5.